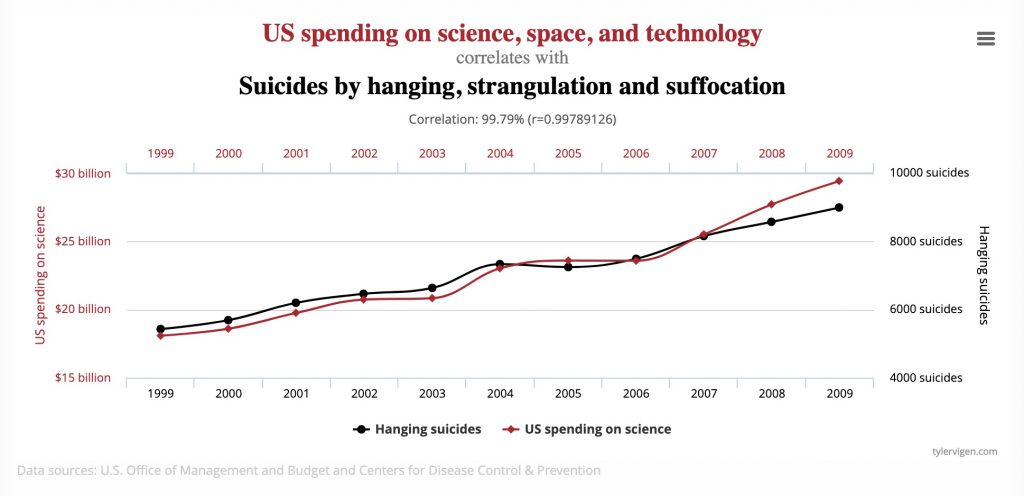
Spurious Correlations looks at some data visualisations that plot two seemingly unrelated datasets and find strong correlations. For example, look at the graph below showing US spending on science, space, and technology vs. suicides by hanging, strangulation and suffocation:
Check out more on the site including number of people drowning in pools vs. number of films starring Nicolas Cage and cheese consumption per capita vs. number of people who died after getting tangled in their bedsheets. The mind boggles.
(And buy the book on Amazon if you want)
Filed under: data viz